This post highlights a few tips that may be necessary to identify the maximum concurrent throughput of one or more application servers with JMeter. They include TCP / IP tuning, load balancer tuning, and garbage collection tuning.
TCP / IP (Red Hat Enterprise Linux / RHEL)
When an HTTP request is made, an ephemeral port is allocated for the TCP / IP connection. The ephemeral port range is 32678 – 61000. After the client closes the connection, the connection is placed in the TIME-WAIT state for 60 seconds.
If JMeter (HttpClient) is sending thousands of HTTP requests per second and creating new TCP / IP connections, the system will run out of available ephemeral ports for allocation.
When JMeter is run in distributed mode, the following message may appear in the jmeter-server.log file if the JMeter server is unable to allocate a port to create a connection to the JMeter client to return the samples.
java.net.NoRouteToHostException: Cannot assign requested address
Otherwise, the following messages may appear in the JMeter JTL files:
Non HTTP response code: java.net.BindException
Non HTTP response message: Address already in use
The solution is to enable fast recycling TIME_WAIT sockets.
echo 1 > /proc/sys/net/ipv4/tcp_tw_recycle
Other options include TCP_FIN_TIMEOUT to reduce how long a connection is placed in the TIME_WAIT state and TCP_TW_REUSE to allow the system to reuse connections placed in the TIME_WAIT state. See this article for more information.
Load Balancing (mod_cluster)
When JMeter is used for performance testing a JBoss Enterprise Application Platform (EAP) cluster with Apache HTTP and mod_cluster, the node status needs to be recalculated frequently.
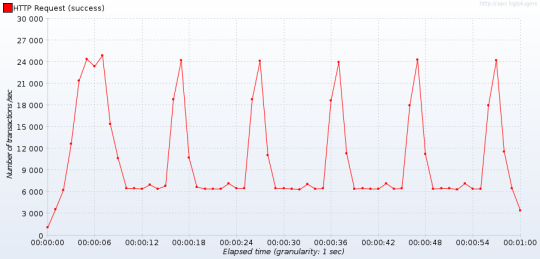
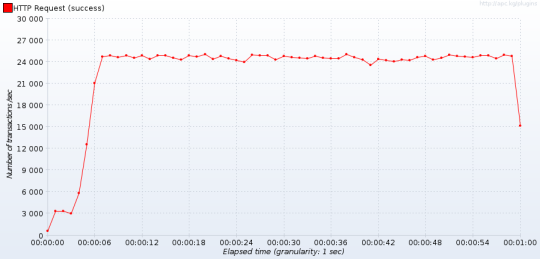
For example, if the peak throughput of a single node is 6,000 transaction per second then the peak throughput of a cluster with 4 nodes should be 24,000 transactions per second.
However, the graph indicates that the throughput varies between 6,000 and 24,000 (1 node / 4 nodes) transactions per second with points at 12,000 and 18,000 (2 nodes / 3 nodes) transactions per second as well.
The solution is set the LBstatusRecalTime to a smaller value in the mod_cluster configuration in the /etc/httpd/conf/httpd.conf file. The default value is 10 (seconds).
LBstatusRecalTime 1
Garbage Collection (JMeter)
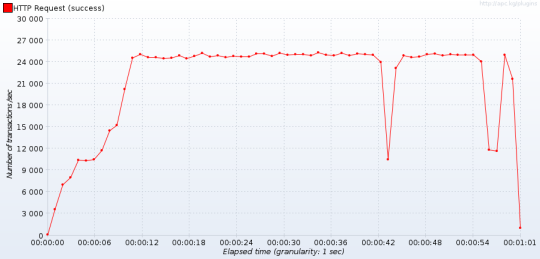
Finally, the throughput may suffer due to pauses due to garbage collection. For example, the following graph indicates two significant drops in throughput that were due to garbage collection.
The solution is to use the Concurrent Mark Sweep (CMS) collector.
Update the jmeter file.
GC="-XX:+UseConcMarkSweepGC"

ARGS="$SERVER $DUMP $HEAP $NEW $SURVIVOR $TENURING $EVACUATION $RMIGC
$PERM $GC"
Additional Information
If JMeter is run in distributed mode, iptables may need to be disabled to identify the maximum concurrent throughput of one or more application servers that are load balanced and / or proxied by an Apache HTTP web server.


October 23, 2014 at 4:50 am
hi, can your share your JMETER profile